
The
Demographics
The total population of Pililla has been rising and falling between 1995 and 2015. There was 2.03 percent increase between 1995 and 2000 but there was also a steep drop of -3% between 2007 and 2010. The simple average of the population figure shows a mere 0.23% increase over the five year span from 2010 to 2015.
The
Population Size
According to the latest PSA Census, Pililla had 64,812 inhabitants in 2015. Quisao accounted for 24.42% of the Total Population, Bagumbayan for 11%, Hulo for 15.3% and Halayhayin for 12.48%. Imatong had the lowest number of inhabitants at 1.43%.
Population Projection of Pililla
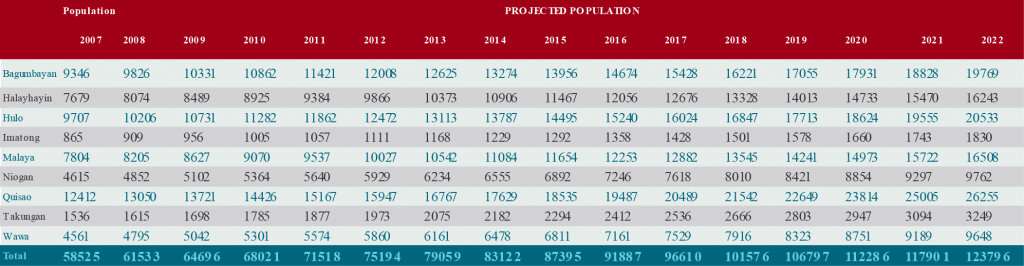
Based on projections, the 2015 total actual population of Pililla fell short by almost 26% of the population projection made in 2010.
Total Population, Household Population and Number of Households by Barangay
(as of May 1, 2010)
Barangay
Total Population
% Share
Number of Households
Average Household Size
Bagumbayan (Pob.)
9,406
15.97%
1,678
5.57
Halayhayin
7,759
13.12%
1,389
5.53
Hulo (Pob.)
9,740
16.59%
1,733
5.6
Imatong (Pob.)
962
1.48%
154
5.62
Malaya
7,721
13.33%
1,486
5.25
Niogan
4,627
7.88%
882
5.23
Quisao
13,284
21.22%
2,387
5.2
Takungan (Pob)
1,643
2.62%
252
6.1
Wawa (Pob.)
4,385
7.79%
860
5.3
Total
59,527
100%
12,841
5.41
In 2010, Quisao had the most number of households representing 19% of the total, followed by Hulo at 13.5%, Bagumbayan at 13% and Malaya at 11.57%. In terms of average household size, Takungan had the biggest size at 6.1 while the remaining 8 barangays had average household size of 5.41.
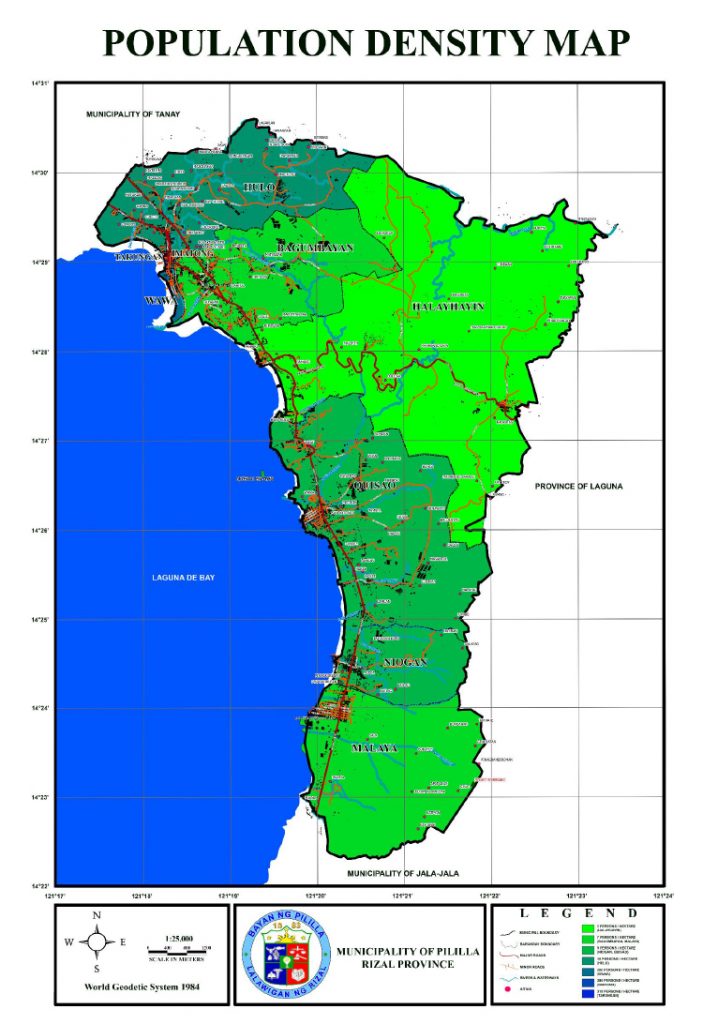
Summary of Major Demographic Characteristics (2010 and 2015)
In 2010, the male population of Pililla outnumbered the females by 2.54%. In 2015, the population density at 927 persons per sq. km. was 175.07% higher than the national average of 337 people per sq. km.
2010 Census of Population and Housing
Total Population
Both Sex
Male
Female
59,527
30,519
29,008
No. of Households
Average Households
Land Area
(Sq. Km.)
Population Density
12,841
5.41
82.18
724.35
Religious Affiliations in Pililla, 2012
In 2010, majority or 71% of Pililla’s population belonged to the Roman Catholic faith. This was followed by affiliations to the Aglipay and Iglesia ni Cristo accounting for 13% and 9.67%, respectively.